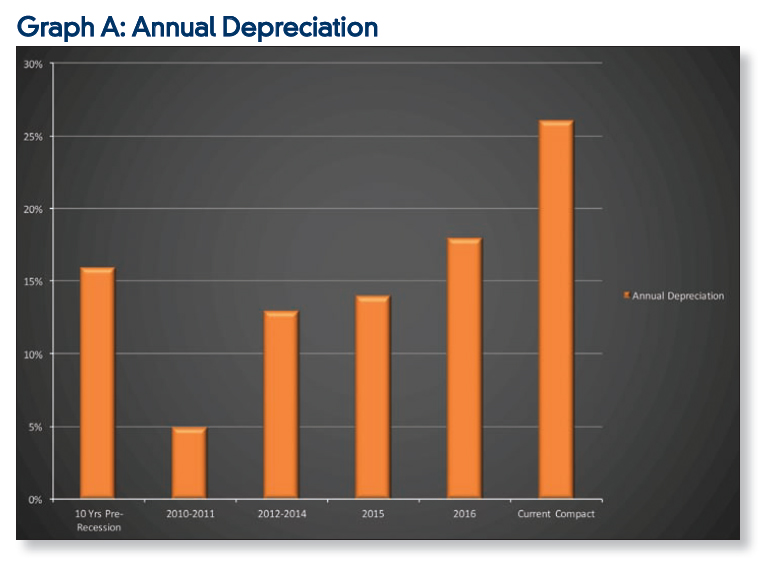
For a decade prior to the recession, used vehicles depreciated an average of 16% per year (NADA Q2 2015 Vehicle Equity). During the recession, vehicle depreciation dropped to a low of 5% annually in 2010-2011, thanks to the Cash for Clunkers program and plummeting new car sales numbers, and then rose back to 13% in 2012-2014, 14% in 2015, and 18% in 2016. Overall, depreciation rates are expected to average around 18% annually through 2017 as used vehicle supply continues to increase rapidly. However, as we saw with trucks and SUVs in the peak of the recession, compact and subcompact cars are seeing significantly worse depreciation. In fact, according to Black Book®, subcompact cars have depreciated 26.1% over the past 12 months. This represents the largest 12-month drop of any segment over the past 10 years.
A recent claim provides a clear example of the impact of this extraordinary depreciation. In April of 2013, a 2011 Volkswagen CC was financed for 75 months at 96% of the then NADA value of $22,200. Three years later, the vehicle was totaled, and with depreciation that averaged ~24% per year on a used vehicle, the loan still showed a deficiency of over $5,400. While average depreciation among all segments might move up and down within a narrower band, individual segments and even particular vehicles can see dramatic swings in depreciation in response to ever changing market conditions and shifting consumer preferences.
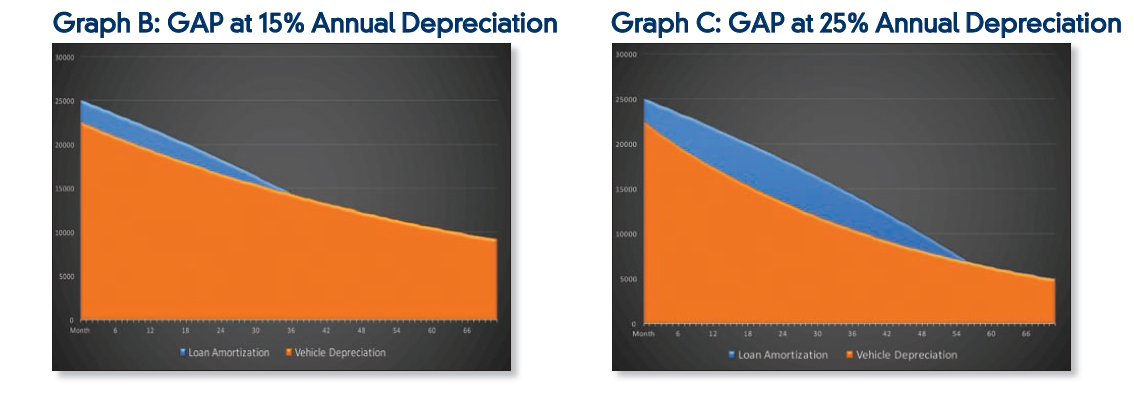
The following graphs help illustrate the significant increase in GAP exposure as vehicle depreciation increases from a more typical 15% per year to a 25% annual depreciation rate that we have been seeing over the past 12+ months on smaller car segments. The areas shaded in blue represent the negative equity in the loan as reflected in the difference between the amortized loan balance and the expected value of the vehicle over the course of the loan at the given annual rate of depreciation. Not only does the number of months that the loan remains under water increase significantly, from 36 months to 56 months on this 72-month loan, but the amount of the deficiency during that period also increases substantially.
In addition to changing consumer preferences, higher incentive spending by manufacturers, and increased off-lease volume, the growth in Certified Pre-Owned (CPO) sales also drives greater depreciation in the used car market. While CPO classification on used vehicles helps increase the market value of the vehicle at time of purchase from dealer lots, the value of the certification is all but gone six or 12 months later when the vehicle is back to being a standard used vehicle. For example, a two-year-old vehicle sold as CPO may get a $1,500 boost in valuation at sale time only to see that benefit disappear within a year, creating exaggerated depreciation that includes the normal vehicle depreciation PLUS the $1,500 credit for CPO. It is nothing more than having a short-term warranty that carries $0 value once the warranty has expired.
Top Factors Driving Increasing Vehicle Depreciation
- New car sales have increased to record levels
- Increased incentives by manufacturers to grow or maintain market share
- Dramatic rise in leasing is driving increase in supply of “off-lease” vehicles
- Changing consumer preferences
- Certified Pre-Owned
The impact of faster depreciation is significant – not only relative to the number of loans in a deficiency balance, but also in how it impacts negative metrics on loan portfolios. An increased number of loans with a deficiency balance unquestionably drives higher GAP losses. Having more loans under water and for a longer period of time greatly increases the potential for GAP claims. Highlighting that impact, we have seen the average months from loan inception to GAP claim increase from a low of 13.3 months in 2014 to nearly 22 months in 2016. This is a clear indication that more loans are staying under water for a longer period of time.
In addition to a dramatic jump in GAP claims, loan portfolios are slowly seeing the impact of strained car values. First, lower car values today mean less equity (or more negative equity) for borrowers when they want to move out of their old car and into a new one. Ultimately, that will contribute toward increasing average LTVs and longer loan terms. Importantly, less equity in vehicles also drives higher default rates – if not seen yet, it is on the near horizon. The probability of repossession is 10.3% when there is negative equity of just $2,000 and increases to 16.4% with negative equity of $5,000 (NADA Q2 2015 Vehicle Equity).
Information provided by Frost Financial Services | www.frostinsure.com
To receive news and informative articles by email from CU Insurance Solutions subscribe to our “Blog Update” by completing the form below.
Contact Us